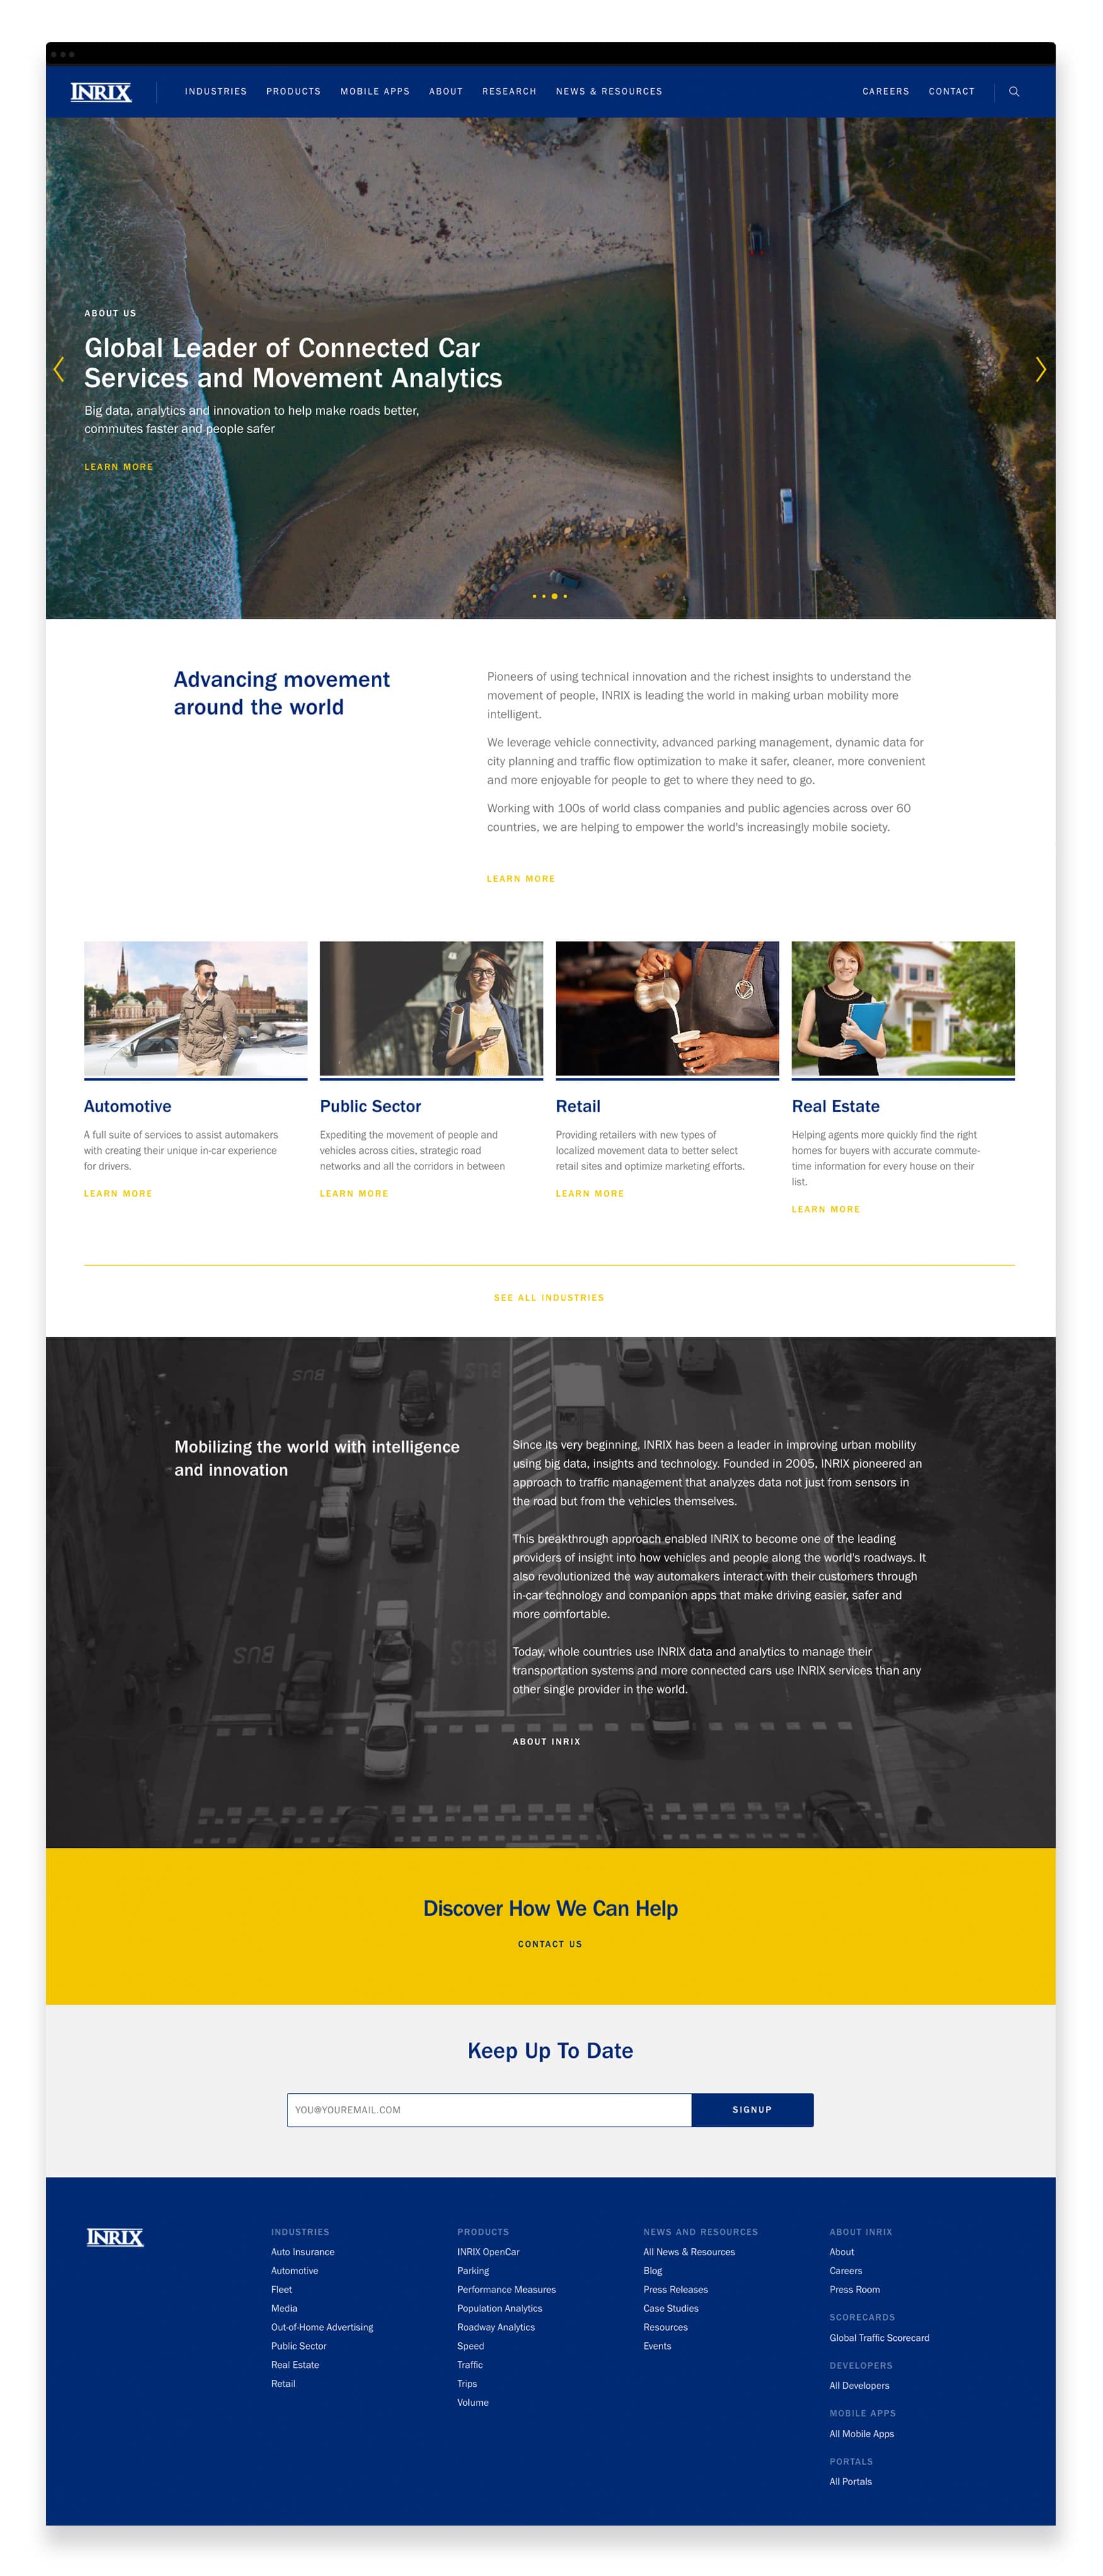
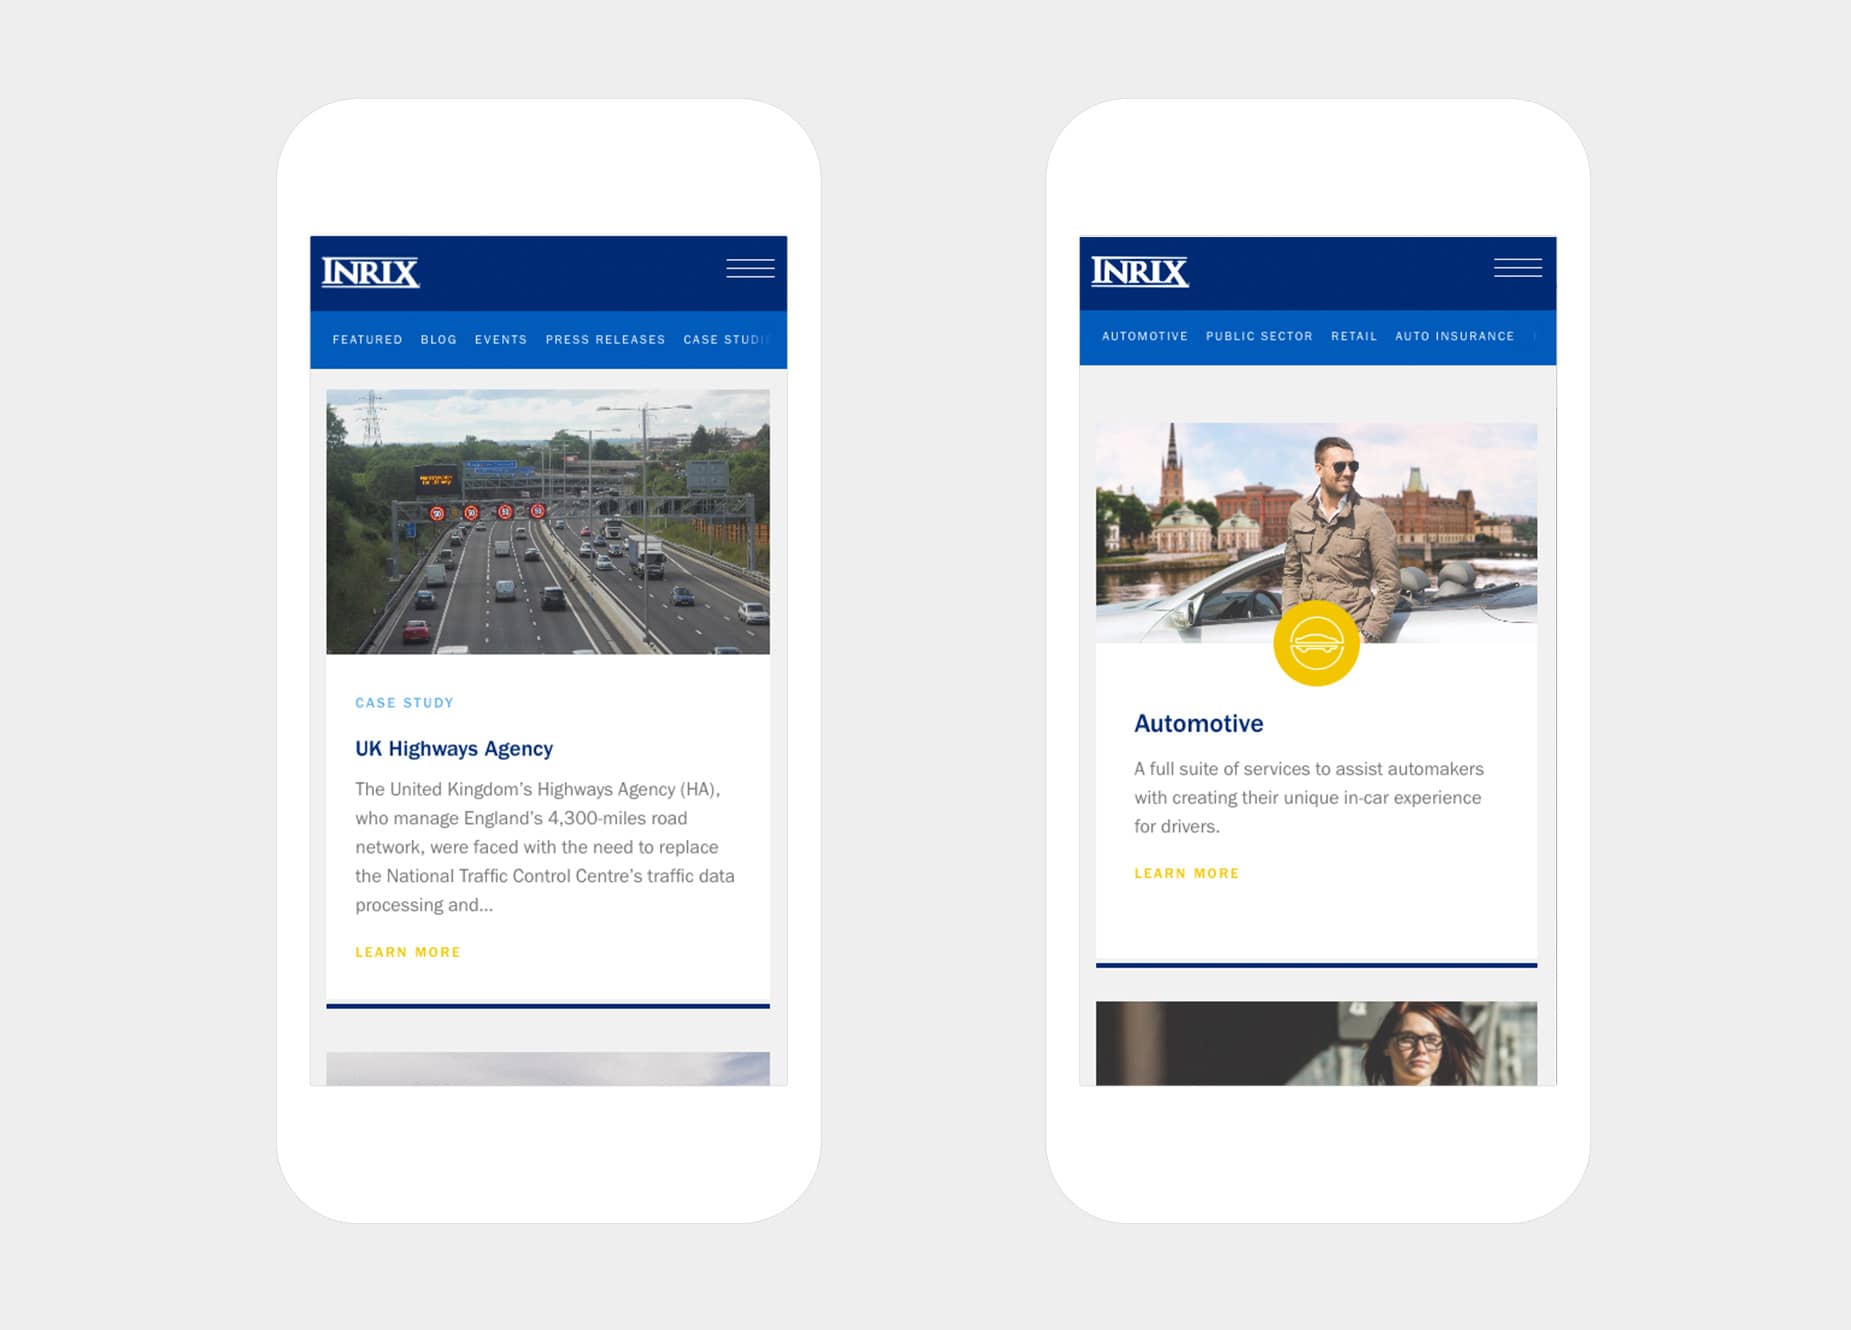
I recently dropped a new Pigeon Wisdom joint for INRIX – the leader in big data analytics for global driving, parking, and traffic applications.
Headquartered in Seattle, with offices worldwide, INRIX develops a variety of mobile and in-car applications that seek to make urban mobility more intelligent.
If you drive a car, have ever used a traffic / parking app, or just live in a city, you’ve undoubtably interacted with an INRIX product, or a product using INRIX data.

Large-scale Wp Build
Over the last few months, we worked closely with the INRIX team to develop a detailed appreciation for their needs and market. As the Company offers a large set of products and solutions, across a wide-range of industries, telling their story was no simple matter. It was essential to deliver a CMS that would provide their digital team with full control over content creation and authorship.

Beyond Pages & Posts
The large-scale WordPress build features a highly-tailored admin experience, using my own system of drag-and-drop ‘modules.’ These modules are essentially components of common UI patterns that can be selected, added and reordered on that code-free hotness.
This flexibility enabled the INRIX digital team to really fine-tune their storytelling efforts on a per page or article basis. No longer locked into static page templates, they could easily introduce new content and layouts for continuous testing, revising and perfecting.
Global Scorecards
In addition to their new marketing site and CMS, a project highlight involved transforming their impressive and exhaustive city traffic big data through interactive data visualization.
Each year, INRIX releases their Global Traffic Scorecards based on stats collected across in 1,064 cities, in 38 countries (the largest study of its kind). This year, we collaborated with their in-house data scientists to develop an SPA-style dashboard of city raking stats, relating to a variety of traffic congestion metrics.
To pull this off, we converted their data into JSON format (from CSV) and used Handlebars.js templating to dynamically populate a single view page featuring Chart.js visualizations, Google Map integration, and custom SVG iconography.
Since much of the Javascript requirements were self authored, the build remained surprisingly lightweight and snappy.
A precursor page provides a variety of related reports, news, infographics, and a filterable/sortable table for city selection – also leveraging handlebars helpers and a custom client-side (JavaScript) sorting script.
You can check out the data vis Scorecards City Page Here
And, the actual Scorecards Page here
Hold Up. Did you say WordPress?
Yeah bruv, WordPress. At it’s heart, Wp is just a php framework, and as such, you can use it to build anything you can in PHP. It’s way less opinionated than people think and it ships with a bunch of handy APIs, like Authentication, Users, Custom Content Types, Custom Fields, etc. Plus, it’s fairly painless to design custom admins that provide clients with a tailored experience for user-friendly and code-free content management. No, it’s not a hipster MVC for sure, but with their new Rest API (which is pretty solid), you can quickly build api-driven application with JavaScript framework and templating libs like Backbone.js and Handlebars.
This means you could even create a decoupled app with a framework like Vue.js for a 100% custom admin and front-end.
And, considering that it powers like 30% of the web, it’s pretty battle-hardened and well documented. Not the right tool for every project, but for some, it does its job reliably.
Here’s my little WordPress & Codekit Starter Framework for the curious.
In the News
The INRIX Scorecards page and reporting received a great deal of high profile attention, including articles on: